
Automated Dispensing Robot Videos

A World of Robotic Dispensing and Assembly Solutions

2026 Best Air Monitoring Systems for Global Buyers

Choosing among the 2026 best Air Monitoring systems takes more than comparing sensor counts or dashboard screenshots. Buyers need evidence that a system fits the place, pollutant, and decision it is meant to support. A roadside station, factory perimeter, and indoor school each present different measurement challenges.

The stakes are real. Dr. Maria Neira, a public-health expert at the World Health Organization, has said, “Air pollution is one of the biggest environmental threats to human health, alongside climate change.” Reliable measurements can help organizations understand changing conditions and make informed choices. But a monitor alone does not guarantee a clear picture.

Details matter. Can the system measure the pollutants of concern? How are sensors calibrated, and how often is maintenance needed? Buyers should also check data access, connectivity, operating range, and the supplier’s documentation. Local monitoring requirements vary, so technical specifications should be reviewed against the intended use and applicable regional guidance.

Look beyond the sales sheet. A neat dashboard may hide gaps in data quality, and a low purchase price may not reflect upkeep costs. This comparison considers those trade-offs across established stations, portable instruments, and connected sensor networks. No single system fits every site. Some questions will remain; field conditions are rarely as tidy as product demonstrations.
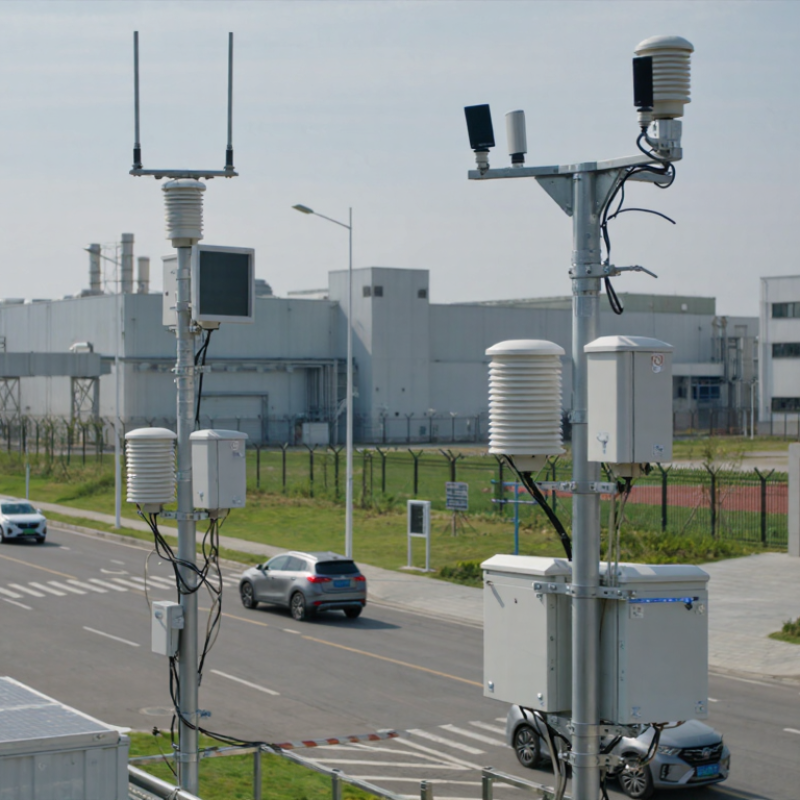
2026 Best Air Monitoring Systems for Global Buyers

Air Monitoring Systems: Pollutants, Sampling Methods, and Core Components

2026 Best Air Monitoring Systems for Global Buyers

Air monitoring systems measure particles and gases, but the right setup depends on the site and decision. Common targets include PM2.5, PM10, ozone, nitrogen dioxide, sulfur dioxide, and carbon monoxide.

The World Health Organization’s 2022 air quality database reports that 99% of the global population lived in places exceeding its air quality guideline levels. That figure makes clear why comparable measurements matter.

Small details matter. A roadside inlet, a factory boundary, and a classroom need different sampling positions and maintenance plans.

Sampling methods shape the result.

Optical particle sensors estimate particulate levels by measuring scattered light; filter-based gravimetric sampling weighs collected particles and can support reference comparisons.

Gas analyzers may use electrochemical cells, infrared absorption, or chemiluminescence, depending on the pollutant. Core components usually include an inlet, pump, flow controller, sensor or analyzer, data logger, and weather protection.

Calibration checks and documented flow rates help reveal drift. The US EPA Air Sensor Guidebook advises users to evaluate sensor performance and compare readings with suitable reference monitors.

Humidity can still complicate optical readings. No setup is perfect.

Buyers should match detection limits, averaging periods, and service intervals to their monitoring purpose, then record those choices consistently.

Global Need: WHO Reports 99% of People Breathe Air Exceeding Its Guidelines

The World Health Organization reports that 99% of people breathe air exceeding its air quality guidelines. This figure makes air monitoring a practical need, not just a technical upgrade. Fine particles can enter homes through open windows, while traffic-related pollution may rise sharply beside a busy road. One reading rarely tells the whole story.

Global buyers should match a monitoring system to the pollutants and setting they need to assess. For many applications, useful measurements include PM2.5, PM10, nitrogen dioxide, and ozone. Placement matters: a unit near a kitchen exhaust or road can record a local spike, not a neighborhood average. A sensor can be wrong. Regular calibration, documented maintenance, and clear data-quality notes help users judge what readings mean.

Low-cost sensors can expand coverage, especially where fixed monitoring stations are sparse. But results may vary with humidity, temperature, and instrument design. Compare devices against trusted reference measurements when possible, and check whether their data can be exported and independently reviewed. The numbers may still leave gaps. That is a reason to pair readings with context, such as location, weather, and sampling time, rather than treat one dashboard as the full picture.

Benchmark Limits: WHO PM₂.₅ Guideline 5 µg/m³; EU 2030 Limit 10 µg/m³

For global buyers, PM₂.₅ performance should be judged against two distinct benchmarks: the WHO’s 2021 annual guideline of 5 µg/m³ and the EU’s 2030 annual limit of 10 µg/m³. These figures are not interchangeable. The WHO guideline is a health-based recommendation; the EU value is a regulatory limit under Directive (EU) 2024/2881. A system should report annual averages clearly, while preserving hourly data to reveal short pollution spikes. Small differences matter.

Look beyond the headline reading. Check whether the instrument has been tested against a reference method, and ask for measurement uncertainty near 5 µg/m³. Humidity can distort low-cost optical sensors, especially during damp mornings; documented correction methods and routine co-location checks help expose drift. The Health Effects Institute’s State of Global Air 2024 report estimated that air pollution contributed to 8.1 million deaths worldwide in 2021. That scale makes data quality consequential, not cosmetic. Still, one sensor cannot represent a whole city. Placement near roads, kitchens, or open windows can skew results, and buyers should admit that limitation. Raw data access matters. Look for calibration records, uptime figures, and clear handling of missing measurements before comparing systems.

Monitoring Technologies: Reference-Grade Stations, Compact Sensors, and Networks

Air monitoring systems serve different purposes, so buyers should match the technology to the question.

Reference-grade stations use controlled inlets and carefully maintained analyzers to support reliable, long-term comparisons. They suit research programs and regional trend tracking, but need trained staff, stable power, and regular servicing.

A station beside a busy road can capture traffic pollution accurately, yet may not represent a whole city. Placement matters.

Compact sensors are easier to install on streetlights, rooftops, or school grounds. They can reveal neighborhood patterns that a few large stations might miss. Their readings, however, can shift with humidity, temperature, or sensor age. Small sensors drift.

A local comparison with a reference station helps identify those changes, though it takes time and careful records. Connected networks can combine readings across many locations and show where conditions vary.

But more data does not automatically mean better evidence. Buyers should check how devices are calibrated, how often data are transmitted, and what happens during network outages.

Climate and maintenance capacity differ by region; a setup that works well in a dry city may need more frequent checks in a humid one. No configuration is perfect, and that trade-off deserves attention.

Buyer Evaluation: Compare Accuracy, Calibration, Coverage, Connectivity, and Lifecycle Cost

2026 Best Air Monitoring Systems for Global Buyers

A strong air monitoring system must perform reliably where it will actually be installed. Compare accuracy across the pollutants and concentration ranges you need, not just headline specifications. Check whether readings remain stable with temperature changes, humidity, dust, or vibration. A sensor that performs well in a clean test room may behave differently beside a loading bay. Ask for test methods and evidence from comparable operating conditions.

Calibration affects both confidence and ongoing work. Review the recommended interval, available calibration records, and the time required to service each unit. Coverage depends on room layout, airflow, and sensor placement; one device may miss a problem behind a partition. Connectivity also matters: confirm data export options, alert delays, and how the system behaves during network outages. Estimate lifecycle cost, including replacement sensors, calibration labor, installation, and downtime. It is easy to overlook staff time. No comparison score captures every site’s quirks, so leave room for a pilot.

Tips: Place a monitor near the area people use, but away from direct vents. Log a week of readings before fixing alert thresholds. Ask who owns calibration tasks; unclear responsibility can quietly weaken good data.

2026 Best Air Monitoring Systems for Global Buyers - Buyer Evaluation: Compare Accuracy, Calibration, Coverage, Connectivity, and Lifecycle Cost

Compare monitoring approaches rather than individual products. Performance, maintenance intervals, regulatory acceptance, and total cost depend on the selected instrument, pollutant, local standards, site conditions, and operating protocol.

Monitoring approach Typical measurements and use Accuracy and key limitations Calibration and quality assurance Coverage and siting Connectivity and data handling Relative lifecycle cost Best-fit buyer profile
Regulatory-grade particulate monitoring Particulate matter such as PM2.5 or PM10, using a reference filter method or an approved continuous method. Can support regulatory-quality data when the complete method, inlet, siting, and quality system meet applicable requirements. Results from different measurement methods are not automatically interchangeable. Requires documented flow checks, audits, filter or instrument procedures, and ongoing quality assurance. Frequency is set by the method, regulator, and operating plan. Point measurement at a carefully selected fixed site; represents local conditions around the inlet, not an entire region. Usually supports scheduled or near-real-time telemetry through a data logger, with local storage and quality-control review. High: specialized equipment, site preparation, skilled servicing, consumables, and data review can contribute substantially to cost. Regulators, research programs, and operators needing defensible long-term trend or compliance data.
Continuous reference gas analyzers Gas-specific measurements, commonly using methods such as chemiluminescence for nitrogen oxides, UV fluorescence for sulfur dioxide, or infrared absorption for carbon monoxide. Performance is method- and instrument-specific. Sample conditioning, interference, leaks, and inlet design can affect results; regulatory suitability depends on applicable approvals and procedures. Typically requires zero and span checks, calibration gas traceability, leak checks, and scheduled preventive maintenance. The required schedule varies by method and local protocol. Point measurement at a fixed station. Inlet placement and sample-line configuration should match the pollutant and monitoring objective. Commonly integrates with data loggers and station networks; remote status and data access depend on the configured system. High: analyzer upkeep, calibration gases, utilities, station infrastructure, and specialist labor should be included. Organizations measuring specific gases for regulatory, industrial, or research purposes with trained operators.
Optical particle sensors and counters Particle number or estimated particle size and concentration; used in screening, indoor monitoring, and supplementary outdoor networks. Optical response depends on particle size, shape, refractive properties, and humidity. Readings may differ from mass-based reference methods, so local comparison is important when mass concentration is required. Needs periodic cleaning and performance checks. Collocation with a suitable reference or higher-quality instrument can identify bias and support site-specific correction. Suitable for multiple distributed locations, but each unit samples only its immediate surroundings. Enclosures and inlet placement matter outdoors. Often available with wired or wireless data output; network reliability depends on power, communications coverage, and data management. Low to medium: hardware may be less costly than reference stations, but deployment, maintenance, and calibration or collocation still add cost. Buyers seeking supplementary spatial coverage, trend screening, or indoor particle monitoring.
Electrochemical gas sensor nodes Selected gases such as carbon monoxide, nitrogen dioxide, ozone, or sulfur dioxide, depending on the sensor configuration. Performance is gas- and sensor-specific. Cross-sensitivity, temperature and humidity effects, aging, and drift can influence readings; performance should be verified under intended conditions. Requires gas-specific checks and periodic calibration or replacement according to the sensor and operating protocol. Collocation is useful for assessing field performance. Useful for distributed local measurements. A node does not represent a broad area without a carefully designed network and interpretation plan. Commonly supports compact loggers and wireless telemetry. Data availability depends on network coverage, power, and device maintenance. Low to medium upfront; lifecycle cost can rise with sensor replacement, calibration, site visits, and data validation. Buyers prioritizing dense, supplementary networks and accepting the need for field checks and data qualification.
NDIR carbon dioxide monitoring Carbon dioxide, often used for indoor ventilation assessment and occupancy-related trends; it does not measure a complete set of air pollutants. Performance and stated accuracy vary by instrument and operating conditions. CO2 is a ventilation indicator in many indoor applications, not a direct measure of overall indoor air quality. Follow the instrument’s verification and calibration guidance. Field checks may be needed where readings inform operational or compliance decisions. Room-level or zone-level monitoring; placement should avoid direct exhalation, supply-air jets, and other unrepresentative locations. Frequently available through building-management interfaces or local network connections; confirm protocol compatibility and data retention needs. Low to medium: total cost depends on sensor quality, integration, installation, verification, and the number of monitored zones. Facility teams monitoring indoor CO2 trends and ventilation, rather than ambient pollution compliance.
Open-path optical gas monitoring Path-integrated concentrations of selected gases, depending on the optical technique and target gas. Measures along an optical path rather than at a single point. Results depend on the method, path length, atmospheric conditions, alignment, and site configuration; it is not directly equivalent to a point-sampler reading. Requires method-specific verification, optical alignment checks, and ongoing review of instrument status and environmental effects. Can cover a defined line of sight across a site, providing path-integrated information rather than a detailed concentration map. Typically uses a fixed instrument and data logger; remote communications and integration are configuration-dependent. High: optical hardware, installation, alignment, site engineering, and specialist maintenance can be significant. Industrial or research sites needing monitoring across a defined path or boundary.

Cost levels are relative, not quoted prices. Before procurement, confirm applicable national or regional method requirements, measurement range, detection limits, environmental operating limits, calibration-gas availability, spare-parts support, data ownership, cybersecurity, and the full service life cost.