
Automated Dispensing Robot Videos

A World of Robotic Dispensing and Assembly Solutions

How to Choose the Best Ceramic Vacuum Filter for Your Needs

Choosing a Ceramic Vacuum Filter is not just a matter of comparing capacity figures. The right choice depends on your slurry, production targets, and maintenance conditions. A filter that performs well with coarse mineral particles may struggle with a fine, sticky feed. Small details matter.

Start by checking the slurry’s particle size, solids concentration, temperature, and chemical properties. These factors influence filtration speed, cake formation, and the materials required for reliable operation. Consider the filtration area, vacuum level, expected throughput, and filtrate clarity together. A high stated capacity means little if the resulting cake is difficult to discharge. Or clean.

Review the ceramic plates, seals, drive system, and available service support. Ask suppliers how their equipment handles your actual feed, not only a standard test mixture. Pilot trials or representative sample tests can reveal issues that a brochure may not show. That gap is easy to overlook. And sometimes the first estimate is wrong.

Think beyond the purchase price. Water use, energy demand, spare-part access, cleaning needs, and operator workload all affect long-term value. Confirm that the proposed filter fits your site layout and connects with existing process equipment. Reliable selection comes from measurable requirements and clear supplier documentation, not promises alone. This guide outlines practical questions to ask, key specifications to compare, and trade-offs to consider before choosing a model. No single machine suits every operation, so leave room to reassess your assumptions when test results or plant conditions differ.
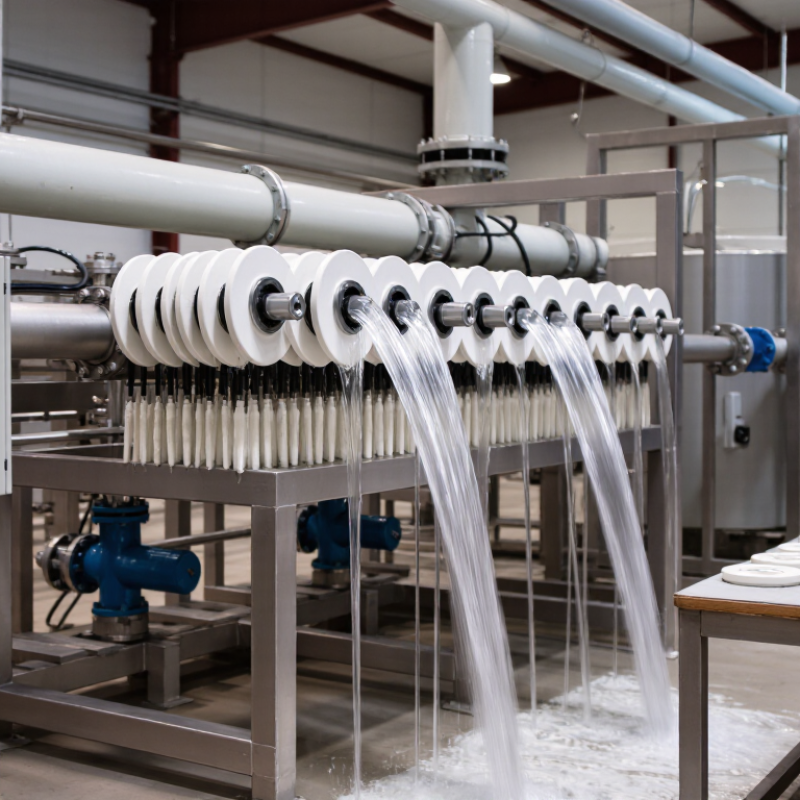
How to Choose the Best Ceramic Vacuum Filter for Your Needs

Define Feed and Target Capacity Using Ceramic Filter Pores of About 1–5 μm

Choosing a ceramic vacuum filter starts with a clear picture of the feed. Record the solids concentration, particle-size range, viscosity, and temperature. Note whether particles are sharp, sticky, or prone to breaking. These details affect cake formation and cleaning, not just filtration speed. Small details matter.

Ceramic pores of about 1–5 μm provide a useful starting range, but the rating is not a guaranteed particle cutoff. Fine particles may pass through before a stable cake forms. Larger particles can bridge pores and improve capture, though they may also create a dense, slow-draining cake. Test representative feed at the expected vacuum level, and measure filtrate clarity, cake moisture, and cycle time. A clear beaker sample alone can be misleading.

Define target capacity as dry solids processed per hour, preferably per square metre of filter area. Then compare it with the feed’s actual solids loading and expected operating hours. For example, a feed with 20% solids needs a different filter area from a 60% solids slurry, even at the same hourly flow. Pilot tests are worth the effort. Results can vary with temperature and small changes in feed, so leave operating margin. I would not choose pores by particle size alone; that shortcut is tempting, but incomplete.

Size Filter Area by Solids Throughput, Feed Concentration, and Cycle Time

A ceramic vacuum filter’s area should match the dry solids it must process, not just the volume of slurry entering the plant. Start with a measured solids throughput, then estimate how much dry material each square metre can handle during one filtration cycle. That capacity depends on particle size, cake permeability, and operating conditions, so use pilot-test data or comparable process records where possible.

Consider a line handling 12 tonnes of dry solids per hour. If the filter completes ten cycles per hour and tests show a loading of 0.8 tonnes per square metre per cycle, the calculated area is 1.5 square metres. Treat this as a starting estimate, not a guaranteed equipment size. Small shifts matter. A more dilute feed sends more slurry through the system and may affect pumping and drainage time, even when dry-solids throughput stays constant. A concentrated feed can form a thicker cake, but may also drain more slowly.

Cycle time changes the calculation directly: longer cycles mean fewer batches per hour and more area may be needed. Check actual filling, filtration, washing, discharge, and cloth-cleaning time, rather than relying on an ideal cycle. Run a trial. That neat calculation can mislead if feed concentration varies across shifts or cake release becomes inconsistent. Leave practical operating margin, then confirm sizing against real feed samples and the required moisture level.

Compare Cake-Drying Performance: Typical Cake Moisture Is About 8–15%

Choosing a ceramic vacuum filter requires comparing final cake moisture, not just throughput. Use 8–15% moisture as a practical screening range, then verify it with representative slurry tests. Wills and Finch’s Mineral Processing Technology, 8th edition (2016), explains that filtration depends on factors such as particle size, slurry properties, and operating conditions. That matters: two feeds can behave very differently on the same filter. A dry-looking cake is not proof of stable performance.

Compare samples at the same feed solids, vacuum level, and cycle time. Measure moisture consistently, and record cake thickness and filtrate clarity alongside it. If the cake stays near 8% but production slows, the result may not suit your process. If it remains near 15%, check whether finer particles or uneven feed are limiting drainage. The benchmark is useful, but it is not a guarantee.

Tips: Test actual process slurry, not water or a convenient substitute. Repeat trials across shifts; one sample can mislead. Note the test method, because inconsistent sampling changes reported moisture. Small detail. Allow time for washing and maintenance when comparing operating results.

Check Vacuum and Cleaning Requirements; Operating Vacuum Often Reaches 0.06–0.09 MPa

When comparing ceramic vacuum filters, verify what 0.06–0.09 MPa means on the supplier’s operating sheet. It usually describes vacuum relative to atmospheric pressure, not absolute pressure. At sea level, that range corresponds roughly to 41–11 kPa absolute. Check the instrument and unit basis. A mislabeled reading can lead to an undersized vacuum pump or an unrealistic performance guarantee.

Match the vacuum level to the slurry, cake thickness, and required moisture, then test a representative sample. Fine particles may blind the ceramic surface, while a dense cake can slow drainage even when the gauge looks right. Ask how cleaning works: note the rinse-water flow, backwash pressure, cycle time, and water quality. Small details matter. The U.S. Department of Energy’s 2006 Improving Pumping System Performance sourcebook reports that pumping systems can account for 25–50% of energy use in some industrial facilities. That figure covers pumping systems broadly, not ceramic filters alone, but it makes pump efficiency and control worth checking. A point to revisit: a higher vacuum reading is not automatically better if it increases power use or complicates cleaning. Compare measured filtrate clarity, cycle time, cake release, and energy consumption during trials.

How to Choose the Best Ceramic Vacuum Filter: Check Vacuum and Cleaning Requirements

Typical operating vacuum is 0.06–0.09 MPa (60–90 kPa). The chart compares gauge vacuum with the corresponding absolute pressure, calculated using standard atmospheric pressure of 101.3 kPa. Confirm that the filter can maintain the required vacuum and that its cake-release and cleaning method suits your slurry and operating cycle.

Assess Lifecycle Cost, Including Energy, Water, Maintenance, and Ceramic Plate Replacement

A ceramic vacuum filter should be judged by cost per dry tonne over its working life, not purchase price alone. Track electricity for the vacuum pump, agitation, and washing at a consistent throughput.

The U.S. Department of Energy’s Mining Industry Energy Bandwidth Study reported that U.S. mining used about 1,246 trillion Btu in 2002, roughly 2.4% of national energy use. That older, sector-wide figure is not a filter benchmark, but it shows why small efficiency losses deserve attention. Small differences compound.

Water needs its own meter. UNESCO’s 2023 World Water Development Report estimates that industry accounts for about 19% of global freshwater withdrawals. Record wash-water use, recycling rates, and discharge costs; a clear filtrate alone does not reveal the full bill.

Include labor, downtime, cleaning, and spare parts in maintenance estimates. For ceramic plates, compare replacement cost and service life under your actual slurry conditions, especially when solids are abrasive. Keep replacement records by operating hours and throughput.

Real plants vary. A neat spreadsheet can still miss an unplanned shutdown, so leave room for that uncertainty.