Top 10 Filling and Capping Machine Manufacturers Worldwide
Selecting a Filling And Capping Machine is not just a matter of comparing output speeds. The right choice depends on the product, container, closure, and actual production conditions. A line filling thick sauce into glass jars faces different challenges from one handling thin beverages in lightweight bottles. Watch the details: foam at the nozzle, cap alignment, bottle stability, and how quickly operators can change formats.
Packaging-line engineer Alex Morgan captures a useful principle: “A machine earns its place when it fills accurately, caps consistently, and changes over without disrupting the shift.” That is a practical lens for this guide. The Top 10 Filling and Capping Machine Manufacturers Worldwide are considered through factors such as equipment range, application experience, automation options, service support, and documented technical capabilities. Those factors matter more than a headline speed that may not match a buyer’s product or container.
No single manufacturer is best for every facility. A compact workshop may value a simple, accessible design; a high-volume plant may prioritize integration, monitoring, and repeatable performance. Buyers should verify specifications directly and request trials using their own product, bottles, and caps. Small variations matter. A cap that looks seated may still leak, and a fast changeover on paper may take longer on the factory floor. This comparison offers a starting point, not a substitute for testing. Real production can be messier than a brochure suggests.
Filling and Capping Lines: Process Stages and Rated Speed (Containers/Minute)
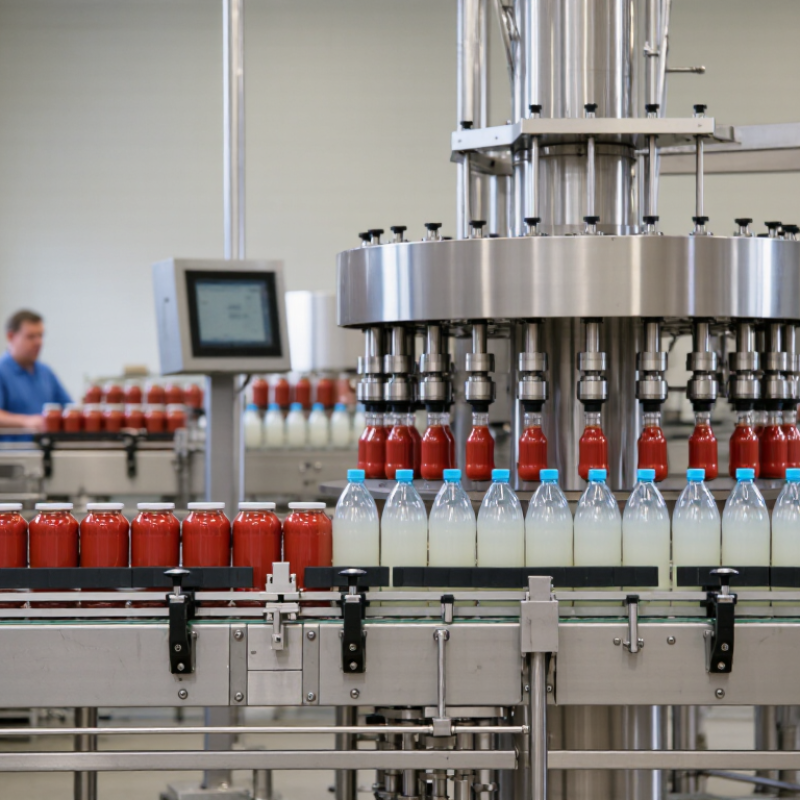
A filling and capping line moves containers through several linked stages: infeed, rinsing or air cleaning, filling, cap placement, tightening, inspection, and discharge. Each station affects the finished output. A filler rated at 180 containers per minute may not sustain that rate if cap feeding or label inspection slows the line.
For planning, compact lines often run around 30–60 containers per minute, mid-range systems around 100–200, and high-output lines roughly 300–600. These are indicative ranges, not guarantees. Container shape, product foaming, fill volume, closure type, and changeover frequency all influence actual speed. A narrow-neck bottle may need gentler handling than a rigid jar. Small details matter.
Ask whether a quoted rating means the filler’s peak speed or the complete line’s rated speed. Also compare the rate using your actual container and product, not an ideal test setup. Track sustained output over a representative production run, including brief stoppages and rejects. A clean speed chart can still mislead. Even a short cap-feed interruption can reduce hourly output, and frequent format changes make the gap wider. The weakest stage sets the pace.
Key Performance Metrics: Fill Accuracy (%), Cap Torque (N·m), and OEE (%)
Fill accuracy, cap torque, and OEE reveal different weaknesses in a filling line. Fill accuracy should be checked across start-up, steady running, and changeovers, not from one sample. OIML R 87:2016 sets quantity-control criteria for prepackages, but it does not define a universal machine-accuracy target. Product viscosity, container shape, and fill volume all matter. A 2 ml drift may look minor; across a long run, it becomes costly.
Cap torque needs equally careful interpretation. Record application and removal torque, then compare results with the closure supplier’s validated range. There is no single suitable N·m value for every cap. Low torque can allow leakage; excessive torque can damage threads or make opening difficult. Test bottles after line adjustments, using consistent sampling and calibrated instruments. Small details matter.
OEE combines availability, performance, and quality under ISO 22400-2:2014. The often-quoted 85% “world-class” benchmark is a useful reference, not a promise for every plant. Track downtime causes alongside the percentage: a blocked cap chute and slow format changeover need different fixes. Be cautious, though. OEE can improve on paper if data collection is inconsistent. Compare manufacturers using the same product, shift length, and measurement rules.
Top 10 Filling and Capping Machine Manufacturers Worldwide - Key Performance Metrics: Fill Accuracy (%), Cap Torque (N·m), and OEE (%)
Anonymized reference profiles for initial equipment benchmarking. Figures are indicative planning ranges, not manufacturer-reported specifications, verified rankings, or guaranteed performance. Actual results depend on the product, container, closure, line setup, and operating conditions.
| Reference profile |
Filling technology / typical application |
Indicative fill accuracy |
Typical cap torque adjustment range (N·m) |
Illustrative OEE range |
Key qualification |
| Profile 01 |
Servo piston; viscous products |
±0.5–1.0% |
0.5–6.0 |
65–85% |
Accuracy depends on product viscosity, temperature, and piston setup. |
| Profile 02 |
Mass-flow filling; liquids with variable density |
±0.2–0.5% |
0.5–6.0 |
60–82% |
Depends on meter selection, calibration, and flow stability. |
| Profile 03 |
Volumetric piston; food and personal-care products |
±0.5–1.0% |
0.5–6.0 |
65–85% |
Product particles and foaming can affect repeatability and speed. |
| Profile 04 |
Net-weight filling; bulk and packaged goods |
±0.2–1.0% |
0.5–6.0 |
60–82% |
Accuracy varies with target weight, product flow, and weighing-system setup. |
| Profile 05 |
Time-pressure filling; low-viscosity liquids |
±1.0–2.0% |
0.5–6.0 |
65–85% |
Fill consistency is sensitive to pressure, liquid properties, and nozzle control. |
| Profile 06 |
Gravity filling; water-like products |
±1.0–2.0% |
0.5–6.0 |
65–85% |
Performance depends on liquid behavior, fill-level control, and container consistency. |
| Profile 07 |
Auger filling; powders and granules |
±1.0–2.0% |
0.5–6.0 |
55–80% |
Powder density, aeration, and dust control influence dosing performance. |
| Profile 08 |
Peristaltic filling; small batches and sensitive liquids |
±0.5–1.5% |
0.5–6.0 |
55–80% |
Tubing condition and liquid characteristics affect repeatability and uptime. |
| Profile 09 |
Hot-fill system; heat-processed beverages and sauces |
±0.5–1.5% |
0.5–6.0 |
60–82% |
Thermal conditions, product foaming, and sanitation cycles affect line performance. |
| Profile 10 |
Multi-format filling and capping line; contract packaging |
±0.5–2.0% |
0.5–6.0 |
55–80% |
Frequent format changes and product changeovers can lower realized OEE. |
Metric note: Fill accuracy is shown as an indicative deviation from the target fill quantity. Cap torque is a broad illustrative adjustment range; the required application torque must be established for each closure and container. OEE is an operating-site measure influenced by availability, performance, and quality, not a standalone machine specification.
Top 10 Global Manufacturers by Beverage, Food, and Pharmaceutical Applications
Across beverage, food, and pharmaceutical production, leading filling-and-capping manufacturers are judged by more than line speed. A practical comparison considers fill accuracy, cap placement, cleaning access, changeover time, and technical support. The top ten may vary by application: a fast bottle line has different demands from a small batch of thick sauce or liquid medicine. Details matter.
Beverage producers often need steady flow, secure caps, and equipment that handles frequent bottle changes. Food plants may require flexible dosing for products with different textures, plus surfaces that are easy to clean. Pharmaceutical applications place particular emphasis on repeatable fills, controlled handling, and clear process records. These needs shape machine design, inspection options, and the level of automation each supplier can provide. No single setup fits every factory.
Buyers should examine real production conditions, not just brochure speeds. Ask how the machine performs during a short run, a format change, or an unexpected stop. A specification sheet can look better than a real shift. That is worth remembering. Strong manufacturers explain operating limits, training needs, and maintenance access plainly. Even then, installation details and operator habits can affect results, so a site trial may reveal issues that a presentation misses.
Filling & Capping Applications: Example Pack Sizes
Common commercial container sizes illustrate how filling and capping equipment serves beverage, food, and pharmaceutical applications. Values are example pack formats in milliliters, not market averages or manufacturer performance data.
Pack sizes vary by product, market, and packaging specification.
Buyer Benchmarks: GMP, 21 CFR Part 11, Line Speed, and Container Flexibility
A filling-and-capping machine should be judged against the whole production task, not its headline speed. Ask suppliers to document output in containers per minute using your product, closure, and container—not an easy test liquid. Include rejects, stoppages, and changeover time. A 120-container-per-minute rating means little if a viscous product causes foaming or caps misfeed. Not just brochure speed. For GMP readiness, examine cleanability, batch records, calibration controls, and how deviations are recorded. For electronic records, check role-based access, audit trails, and signature controls against 21 CFR Part 11 requirements. A demo is useful; a witnessed acceptance test is better.
Container flexibility needs proof, too. Test the smallest and largest formats, then run a changeover with the actual guides, chuck, and recipe settings. That is the catch. Grand View Research valued the global pharmaceutical packaging market at about USD 124.8 billion in 2023 and projected 6.8% annual growth through 2030. This market estimate signals investment, but it does not prove any machine’s throughput or compliance. Ask for the report’s assumptions, and request performance data for comparable products. One awkward point: more format flexibility can add setup steps and maintenance. Record those minutes during trials, not after installation.